Remediate Kubernetes Issues Using Robusta


After you have identified what might be wrong with your cluster, you need a solution fast. During this entire process,it takes time to get out your laptop, investigate the issue, open a PR, and redeploy to production.
Can We Make It Faster?
When troubleshooting K8s clusters, it can be difficult to identify and address issues. The cause of an issue isn’t always obvious – it could be a fault in a pod, a container, the control plane, or other components.The complexity only increases when dealing with large-scale production environments and many microservices.
Dealing with these issues manually increases not only the time to respond but also the downtime of your application. This is where Kubernetes consulting services can help by providing expert insights, proactive monitoring,and automated solutions to streamline troubleshooting. Let’s identify what can be done to solve these issues.
Automated Enrichments
In Kubernetes, we observe logs, events, and resources in our cluster to identify and understand issues. For example, we can identify OOMKilled errors, sudden jumps in load, and faulty deployments by looking at events or logs of these resources.
Manually getting these insights by interacting with your cluster can be time-consuming. Having a system in place to send us these insights can be very helpful to understand our cluster whenever something goes wrong. Fortunately, we have tools like Prometheus to send us alerts.
We can create a system to take these alerts, enrich them by adding data on what these alerts mean,and tell us what we can do to fix the issue.
Automated Remediations
Great! Now we have identified what might be wrong with our cluster. We can manually resolve these issues by following a set of known steps. Still, the problem of fixing known issues manually isn’t great, especially not in production environments.
But wouldn’t it be nice to have some automation? We’d like a system in place which detects issues and remediates them, even with temporary fixes.
What is Robusta
Instead of reinventing the wheel to solve the above problems, we can use Robusta.
Robusta is an open-source platform for multi-cluster Kubernetes monitoring,
troubleshooting, and automation. Just like Docker is infrastructure-as-code for deploying applications,Robusta is infrastructure-as-code for maintaining K8s applications and handling their alerts.
Robusta is an automation engine that listens to different sources of data like changes in your Kubernetes cluster, Prometheus alerts, and more. Using these data sources, Robusta runs automations that help resolve problems in your cluster.
Robusta has automations in place to handle alerts in your kubernetes cluster by sending them to sinks with added enrichments that tell you what is happening in your cluster. It also suggests common fixes that give us better alerts.
Robusta also monitors the API server and sends alerts to cover any type of issues your cluster might be having.
Additionally, Robusta helps you to automate the process of manually fixing these issues by providing you with actions that actively run procedures in your cluster. This solves our problem of having a system in place to automate our remediation process. Let’s take a look at the remediation process of Robusta.
How do remediations work in Robusta?
Remediations in Robusta are handled through Callback findings sent to your Slack sink.
What are callbacks in Robusta and how do they help run procedures in your cluster?
Callbacks
Callbacks are a set of buttons that allow chat apps like Slack to quickly trigger a Robusta action when clicked. These are sent as messages to Slack where you can use these buttons to run remediations on your clusters. Robusta runs these remediations on your cluster on your behalf.
Understanding the flow of a Callback request
Let’s understand how these callbacks work. We can understand this by taking an example action provided by Robusta called alert_on_hpa_reached_limit. It sends a finding to your Slack sink when the HPA reaches its maximum replicas and allows fixing it using a Callback.
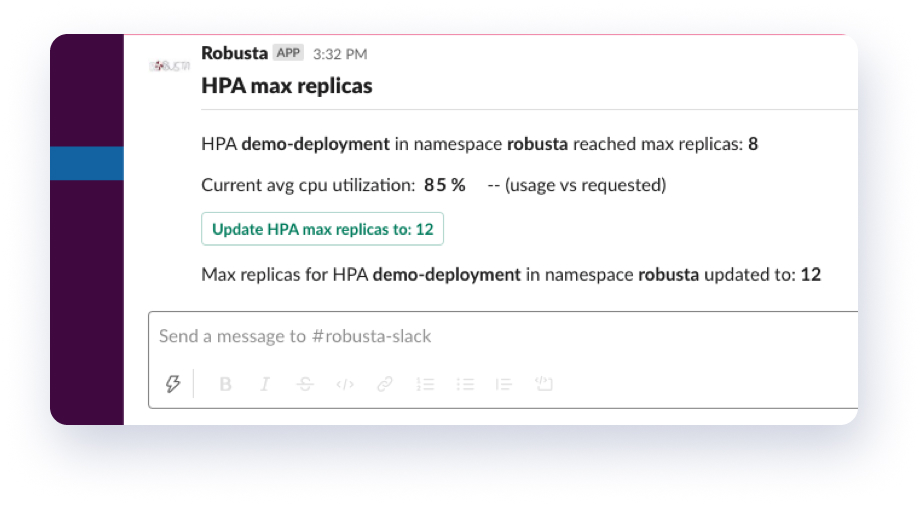
What happens when you press this Callback button?
Since the Robusta runner doesn’t have an external DNS address, you have to route the requests to your cluster in another way. For that, Robusta has a service called the relay which runs in Robusta’s cloud environment.
When the callback button is pressed, metadata is sent to the relay. This metadata contains a signature from runner itself, the accounts ID and the cluster ID.Using this metadata, Robusta checks if the request is valid or not and which remediations need to be performed. The relay checks if the client is connected. If so, the request is sent to the runner deployed on your cluster and the remediation is performed.
All this can be understood visually using the following image:
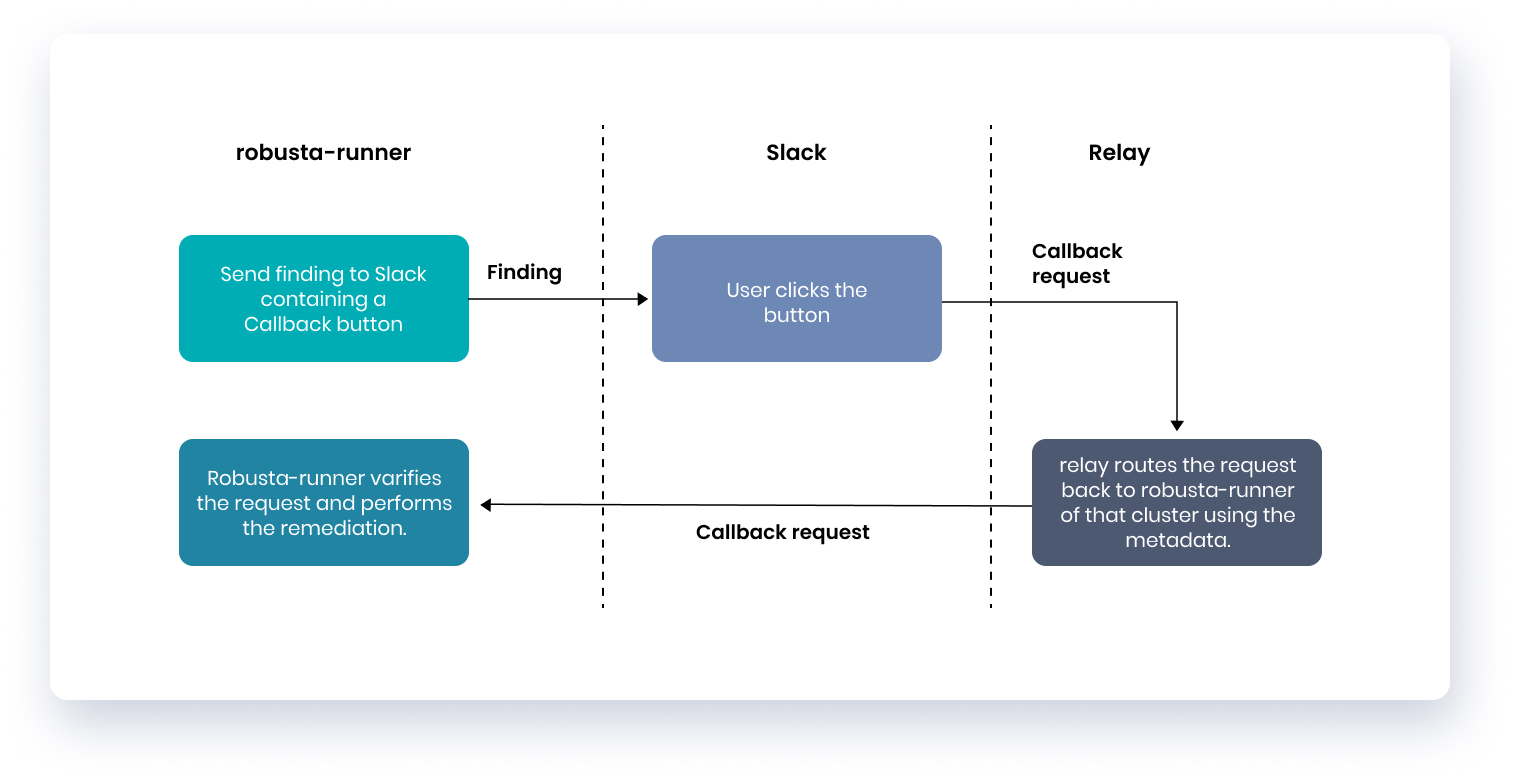
Note: Cloud routing can be disabled from your config when installing Robusta.
Conclusion
Having some automation in place to handle cluster problems is extremely useful,
especially when managing clusters on a massive scale. It really helps in decreasing the time taken to remediate unexpected behavior in clusters.
Robusta does a great job on resolving some common problems the cluster might face.
Automatic remediations can decrease downtime the clusters would otherwise face in the future.
Related Articles
Related Articles
Established in 2012, Xgrid has a history of delivering a wide range of intelligent and secure cloud infrastructure, user interface and user experience solutions. Our strength lies in our team and its ability to deliver end-to-end solutions using cutting edge technologies.
NAVIGATE
Cloud & DevOps Web & Mobile Apps Temporal Digital Marketing GTM Engineering Marketo Consulting HubSpot Consulting Company Careers ResourcesOFFICE ADDRESS
US Address:
Plug and Play Tech Center, 440 N Wolfe Rd, Sunnyvale, CA 94085
Dubai Address:
Dubai Silicon Oasis, DDP, Building A1, Dubai, United Arab Emirates
Pakistan Address:
Xgrid Solutions (Private) Limited, Bldg 96, GCC-11, Civic Center, Gulberg Greens, Islamabad
Xgrid Solutions (Pvt) Ltd, Daftarkhwan (One), Building #254/1, Sector G, Phase 5, DHA, Lahore
Xgrid © 2026. All rights reserved.