
Temporal Cloud Billing API: Cost Attribution Beyond the Invoice


Temporal (a durable execution platform for long-running, fault-tolerant workflows) bills on usage: you pay for what your workflows actually do, not for reserved capacity that sits idle. As Temporal adoption scales across multiple teams, namespaces, and workflow types, “usage-based” stops being a simple concept. Which team owns the spike? Which workflow type is burning through actions? Is that cost increase expected, or a symptom of a retry storm somewhere in production?
Temporal Cloud’s GA Billing API and Billable Action Count metric were built to answer those questions. This post explains what those tools expose, how they differ, and what platform, engineering, and FinOps teams can build on top of them.
Direct answer summary
The Temporal Cloud Billing API is a programmatic cost-reporting surface in the Cloud Ops API that breaks spend down by namespace at monthly, daily, and hourly granularity covering Actions, Active Storage, Retained Storage, support fees, and add-ons. Namespace Tags enable team-level cost attribution with retroactive effect. The Billable Action Count metric, exposed via Temporal’s OpenMetrics endpoint at one-minute granularity, explains why costs move by breaking action counts down by action type, namespace, and workflow type. Together, they turn Temporal spend from a monthly invoice line item into an observable signal that supports alerting, debugging, chargeback, and design-time cost forecasting.
What does the Temporal Cloud Billing API give you that your invoice doesn’t?
The Temporal Cloud Billing API is a cost-reporting API that returns namespace-level spend decomposed by cost component, at up to hourly granularity. It solves invoice blindness, the gap between a total monthly bill and the specific events that caused it by exposing structured breakdowns you can pipe into FinOps dashboards, chargeback models, and scheduled reports instead of waiting for a PDF at the end of the month.
A billing invoice tells you the total. The Billing API tells you the story behind it. With the API, you get cost data broken down by namespace at monthly, daily, and hourly granularity. Each row contains a decomposition: Actions, Active Storage, Retained Storage, support fees, and add-ons. You can see exactly which cost component is moving and which namespace it is coming from.
Hourly resolution means you can correlate a cost spike to a specific event: a campaign launch, a batch job, a deployment rather than noticing it a month later when the invoice arrives. Reports are available via the Cloud Ops API, CSV download, and native integrations with Datadog and Vantage.
| Source | Granularity | Best for | Limitation |
| Invoice | Monthly total | Budget reconciliation | No namespace or component breakdown |
| Billing API | Monthly, daily, hourly | Cost attribution, chargeback, FinOps pipelines | Retrospective; reports dollars, not action rate |
| Billable Action Count (OpenMetrics) | One-minute | Alerting, debugging, forecasting | Reports usage volume, not dollar amounts |
How do you attribute Temporal Cloud costs across teams and products?
Temporal Cloud cost attribution across teams works through Namespace Tags user-defined key-value labels attached to namespaces via the Cloud Ops API. The Billing API reads those tags in real time when generating reports, so you can apply a taxonomy retroactively and have historical costs attributed correctly without re-running pipelines or waiting for the next billing cycle.
Most engineering organizations running Temporal at scale operate across multiple teams. Without attribution, cost is a single number that nobody owns. With attribution, it becomes a signal every team can act on and a foundation for internal chargeback if your platform team runs Temporal as a shared service.
Key insight: Real-time tag reads mean a month-old namespace tagged today shows up correctly attributed in all historical reports, not just future ones. You do not lose retroactive visibility because your taxonomy was not ready at launch.
Implementation pattern:
- Define a tag schema (e.g., team, product, cost-center) before or after namespace creation.
- Apply tags via the Cloud Ops API to every production namespace.
- Schedule a billing report pipeline (daily or hourly) and join tag dimensions in your FinOps warehouse or chargeback tool.
The diagram below shows how tagged namespaces feed both the Billing API and the Billable Action Count metric into a single FinOps pipeline.
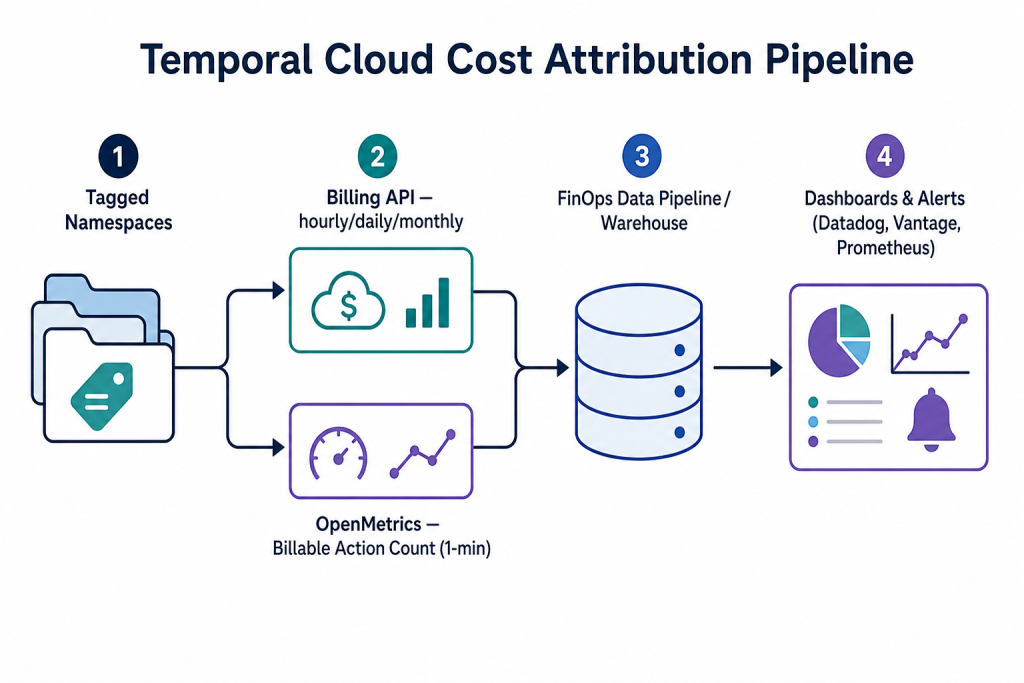
Figure 1: Tagged namespaces feed both the retrospective Billing API and the near-real-time Billable Action Count metric into a single FinOps pipeline, which powers dashboards and alerts.
What is the Billable Action Count metric, and why does it explain your bill?
The Billable Action Count metric is a near-real-time usage counter exposed through Temporal’s OpenMetrics endpoint. It breaks action volume down by Action Type, Namespace, and Workflow Type at one-minute granularity. Cost attribution from the Billing API tells you which namespace is expensive; Billable Action Count tells you why workflow types and action categories are driving the spend, including retry storms that would otherwise stay invisible until the invoice.
Workflow type-level attribution
Workflow type-level attribution lets you identify which workflow definition inside a namespace is consuming actions. Your most expensive namespace might contain a dozen workflow types. Some are lightweight; one might run 40,000 actions an hour. The Billable Action Count metric surfaces that workflow type without custom instrumentation or added logging.
Usage alerting before the bill arrives
Billing reports are retrospective. A metric at one-minute granularity can feed an alert that fires when action rate crosses a threshold you set. If a workflow type is consuming actions 3× faster than its baseline, a classic retry storm signature you know in minutes, not at the end of the month.
temporal_cloud_v1_billable_action_count (currently in Public Preview) is a pre-computed per-second rate, labeled by action_type and temporal_workflow_type. Because it already is a rate, Temporal’s own migration guidance says not to wrap it in PromQL’s rate(), increase(), or irate() — use sum(), avg(), max(), or min() instead. This is different from the deprecated temporal_cloud_v0_* PromQL endpoint, which is being retired on October 5, 2026.
Example Prometheus alert rule. Namespace scope is set once, at scrape time, via the namespaces query parameter in the scrape config below not as a PromQL label filter, since billable_action_count is labeled only by action_type and temporal_workflow_type:
groups:
  - name: temporal_cost_alerts
    rules:
      - alert: TemporalWorkflowActionSpike
        expr: |
          sum by (temporal_workflow_type) (
            temporal_cloud_v1_billable_action_count
          )
          >
          3 * avg_over_time(
            sum by (temporal_workflow_type) (
              temporal_cloud_v1_billable_action_count
            )[1h:5m]
          )
        for: 10m
        labels:
          severity: warning
        annotations:
          summary: "Action rate spike for {{ $labels.temporal_workflow_type }}"
Workflow debugging
Action count anomalies are often the first signal of a logic bug. A workflow supposed to run 10 activities per execution but running 200 is retrying excessively, looping unexpectedly, or hitting an unintended code path. The Billable Action Count metric surfaces this before it becomes a support ticket and before a retry storm inflates the next invoice.
Granular cost forecasting
Historical action counts by workflow type, aggregated over time, produce accurate input for cost forecasting. When a new workflow type is being designed, you can benchmark its action profile against existing types and project its cost contribution before it ships, turning workflow orchestration ROI into a number you can defend before code is written rather than after the first invoice.
Example OpenMetrics scrape config. Note the endpoint is a single global host per account (metrics.temporal.io), not a per-namespace address, and requires a Service Account API key with the Metrics Read-Only role:
scrape_configs:
  - job_name: temporal_cloud_openmetrics
    scrape_interval: 60s
    metrics_path: /v1/metrics
    scheme: https
    bearer_token: <TEMPORAL_CLOUD_METRICS_API_KEY>
    params:
      namespaces: ["prod-*"]
    static_configs:
      - targets: ["metrics.temporal.io"]
What can your FinOps team stop doing manually?
Without the Billing API, Temporal cost attribution typically means exporting the invoice, cross-referencing a hand-maintained spreadsheet, manually splitting the total, and sending a report once a month if everyone remembers. With the API, attribution becomes a scheduled data pipeline. The same data can feed chargeback models for platform teams that run Temporal as an internal service.
A typical automated pipeline: call the Billing API on a schedule → land results in your warehouse → join Namespace Tags → expose dashboards in Datadog, Vantage, or an internal FinOps portal. Engineering teams get self-serve visibility; FinOps gets auditable, repeatable reporting instead of a monthly fire drill.
How do you catch workflow efficiency problems before they compound?
Temporal bills on actions workflow starts and completions, activity scheduling and execution attempts, signal sends, query responses, and timer fires. A poorly designed workflow that retries aggressively, polls frequently, or spawns child workflows unnecessarily pays for that inefficiency in actions. The Billable Action Count metric makes this visible at the workflow type level before it compounds over months into a home-grown workflow orchestration cost problem nobody planned for.
| Symptom | Likely cause | Fix | How to verify |
| Action count 10× higher than peer workflows | Aggressive retry policy or activity timeout loop (retry storm) | Tune maximumAttempts, startToCloseTimeout; add idempotency keys | Compare billable_action_count by workflow_type before/after deploy |
| Steady action rate with no business traffic | Polling loop or timer firing too frequently | Replace polling with signals; increase timer intervals | Inspect workflow history for repeated timer/activity patterns |
| Spike after deploy | New code path or child-workflow fan-out | Review diff; add workflow versioning (workflow.getVersion()) | Correlate deploy timestamp with hourly Billing API action component |
| Namespace cost up, single workflow type flat | Storage growth, not actions | Check Active Storage and Retained Storage rows in Billing API | Compare Actions vs storage columns in API response |
Common mistakes when implementing Temporal Cloud cost visibility
- Waiting for the invoice to drive engineering decisions.
Monthly totals arrive too late to catch runaway workflows. Fix: scrape Billable Action Count and alert on per-workflow-type baselines.
- Tagging namespaces only at creation time.
Teams often defer taxonomy until namespaces already exist. Fix: apply Namespace Tags retroactively—the Billing API re-attributes historical data on read.
- Attributing cost at the account level only.
Account-wide alerts create noise and hide the offending workflow type. Fix: scope Prometheus rules and dashboards by workflow_type and namespace labels.
- Wrapping an already-rate metric in PromQL’s `rate()`.
temporal_cloud_v1_billable_action_count is delivered as a pre-computed per-second rate, not a counter. Applying rate() or increase() on top of it produces silently wrong numbers. Fix: aggregate with sum(), avg(), max(), or min() instead, per Temporal’s OpenMetrics query conventions.
- Ignoring storage line items.
Action spikes get attention; Active Storage and Retained Storage growth can dominate spend for history-heavy workflows. Fix: include storage columns in every scheduled billing report.
- Building a one-off script instead of a pipeline.
Ad-hoc exports do not scale across teams. Fix: schedule API pulls, version your tag schema, and document ownership in your platform runbook or bring in a partner who has built this pipeline before.
What changes for teams running Temporal at scale?
The Temporal Cloud Billing API and Billable Action Count metric do not change what Temporal does. They change how clearly you can see what it is doing and what it is costing. For platform engineering, cost attribution becomes a data pipeline problem, not a monthly reconciliation task. For FinOps, Temporal spend becomes as observable as any other cloud cost. For engineering teams, the feedback loop from workflow design to cost impact becomes short enough to influence design decisions before code ships turning workflow orchestration ROI from a retrospective argument into a design-time input.
Frequently asked questions
What is the Temporal Cloud Billing API and what data does it expose?
The Temporal Cloud Billing API is part of the Cloud Ops API. It provides namespace-level cost data broken down by Actions, Active Storage, and Retained Storage at monthly, daily, and hourly granularity. Reports are available via API, CSV download, and integrations with Datadog and Vantage.
How granular is Temporal Cloud billing data, and how is it different from the Billable Action Count metric?
The Billing API provides cost data at hourly granularity and is retrospective useful for attribution and reporting. Billable Action Count is available at one-minute granularity via the OpenMetrics endpoint and is near-real-time useful for alerting, debugging, and forecasting. Use both: billing data for dollar attribution, the metric for operational observability.
Can I attribute Temporal Cloud costs to specific teams using namespace tags?
Yes. Namespace Tags are user-defined key-value labels attached to namespaces via the Cloud Ops API. The Billing API reads them in real time, so retroactive tagging re-attributes historical costs without re-running reports. Namespace tags are the primary mechanism for team-level cost attribution in Temporal Cloud.
What counts as a billable action in Temporal Cloud?
Billable actions include workflow starts and completions, activity task scheduling and execution attempts, signal sends, query responses, and timer fires. Actions are counted per event, not per workflow execution—a workflow with aggressive retry policies or frequent polling accumulates more actions than a well-designed equivalent handling the same business logic.
How do I set up automated cost alerts for Temporal Cloud workflows?
Configure Prometheus to scrape Temporal’s global OpenMetrics endpoint (metrics.temporal.io) using the scrape config in the section above, then deploy an alert rule targeting temporal_cloud_v1_billable_action_count. Since this metric is already a per-second rate, aggregate it with sum() or avg() rather than wrapping it in rate(), and scope alerts by the temporal_workflow_type label to avoid account-wide noise. For budget-level alerts, schedule Billing API pulls and compare current-period spend against thresholds in your FinOps pipeline.
Does retroactive namespace tagging affect already-exported billing reports?
New exports and API calls reflect updated tags immediately, including historical periods in the report window. If you cached reports in a warehouse, re-run the pipeline or backfill tag dimensions from your namespace inventory tags are read at report generation time, not stored only at namespace creation.
Is cost visibility part of a broader Temporal production health check?
Yes. Cost anomalies like a workflow type suddenly consuming 3× its baseline actions—are frequently the first observable symptom of the same failure modes (retry storms, stuck workflows, unbounded fan-out) that a production health review is designed to catch. Teams already running a stabilization review typically fold cost alerting into the same observability workstream rather than treating it as a separate project.
Does Xgrid offer implementation support for Temporal Cloud cost visibility?
Yes. Xgrid is a certified Temporal partner, and cost observability is one of the workstreams covered in the Temporal 90-Day Production Health Check alongside failure-mode review, incident retros, and cluster configuration checks. Talk to a Temporal engineer →
Running Temporal at scale means your cost model has to scale with it
Namespace tagging, billing pipelines, and OpenMetrics alerting are one part of a larger production-readiness picture. Teams running Temporal at scale tend to hit cost blind spots at the same time they hit retry storms, stuck workflows, and on-call fatigue—because all four are symptoms of the same missing observability layer. Xgrid’s Temporal 90-Day Production Health Check gives your team a risk profile, a quick-wins list, and a stabilization roadmap in three weeks including the namespace tagging strategy, billing report automation, and Prometheus alert rules described in this post. See how we do it →
Related reading
- Temporal Cloud Ops API documentation (official Temporal docs)
- Temporal OpenMetrics endpoint reference (official Temporal docs)
- Xgrid: Temporal Launch Readiness Review — for teams evaluating Temporal before their cost model exists yet
- Xgrid: Temporal 90-Day Production Health Check for teams already in production who need cost, reliability, and observability reviewed together
Related Articles
Related Articles

Established in 2012, Xgrid has a history of delivering a wide range of intelligent and secure cloud infrastructure, user interface and user experience solutions. Our strength lies in our team and its ability to deliver end-to-end solutions using cutting edge technologies.
NAVIGATE
Cloud & DevOps Web & Mobile Apps Temporal Digital Marketing GTM Engineering Marketo Consulting HubSpot Consulting Company Careers ResourcesOFFICE ADDRESS
US Address:
Plug and Play Tech Center, 440 N Wolfe Rd, Sunnyvale, CA 94085
Dubai Address:
Dubai Silicon Oasis, DDP, Building A1, Dubai, United Arab Emirates
Pakistan Address:
Xgrid Solutions (Private) Limited, Bldg 96, GCC-11, Civic Center, Gulberg Greens, Islamabad
Xgrid Solutions (Pvt) Ltd, Daftarkhwan (One), Building #254/1, Sector G, Phase 5, DHA, Lahore
Xgrid © 2026. All rights reserved.