How We Got 30x More EKS Metrics While Slashing Client Costs
During a recent deep dive into a client’s EKS infrastructure, we decided to rigorously test this very principle. Our investigation into the enhanced_container_insights flag in AWS CloudWatch didn’t just challenge the “less is cheaper” rule—it completely inverted it.
We uncovered a powerful paradox where strategically increasing our metric volume by over 3000% led to a direct 21% reduction in the overall monitoring bill.
This wasn’t a billing error. It was a discovery rooted in the deep architectural nuances of AWS, and it represents a significant optimization opportunity for any team running EKS.
The Investigation: Deconstructing the CloudWatch Bill
Our analysis began with a controlled test. We started with EKS Enhanced Container Insights enabled, which was collecting over 15,000 metrics. We then disabled it, and as expected, the metric count dropped by 95% to under 500.
The surprise came when we analyzed the cost data: the bill went up.
Our investigation immediately focused on the Cost and Usage Report, where we found our first critical piece of evidence.
Evidence #1: A Fundamental Shift in Billing Architecture
The data revealed that the enhanced_container_insights flag is not a simple on/off switch. It’s a toggle between two completely different billing models.
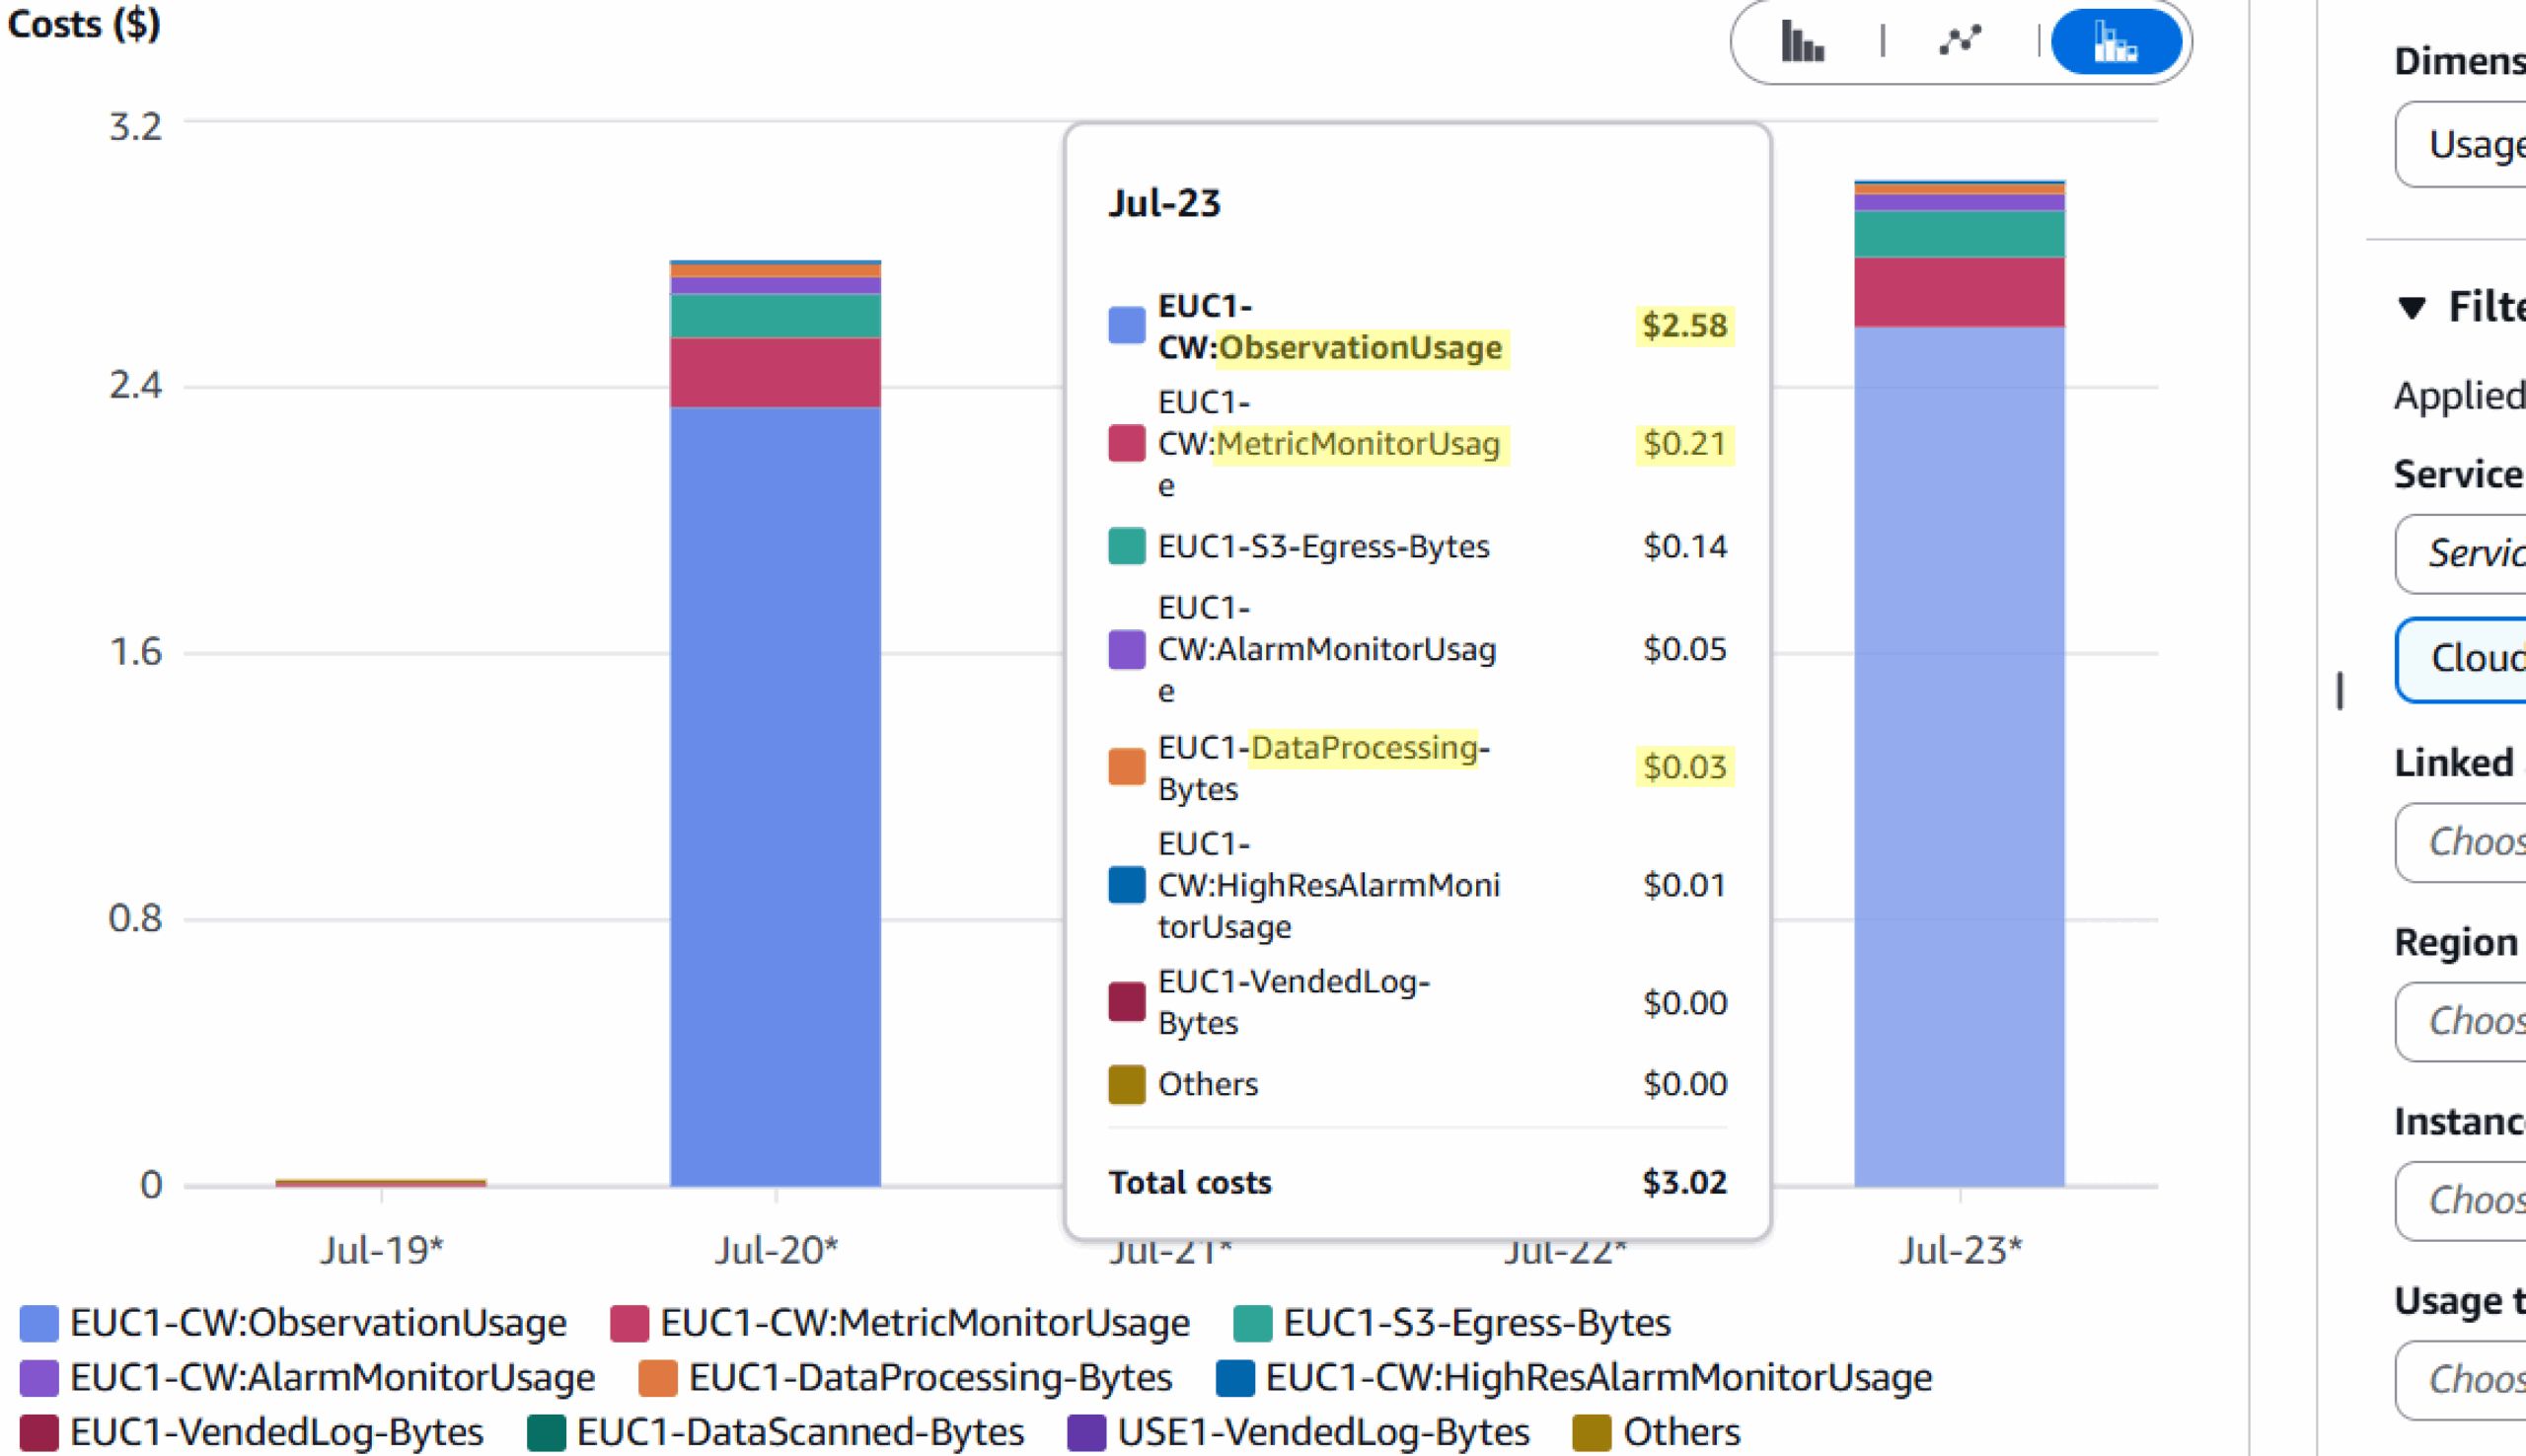
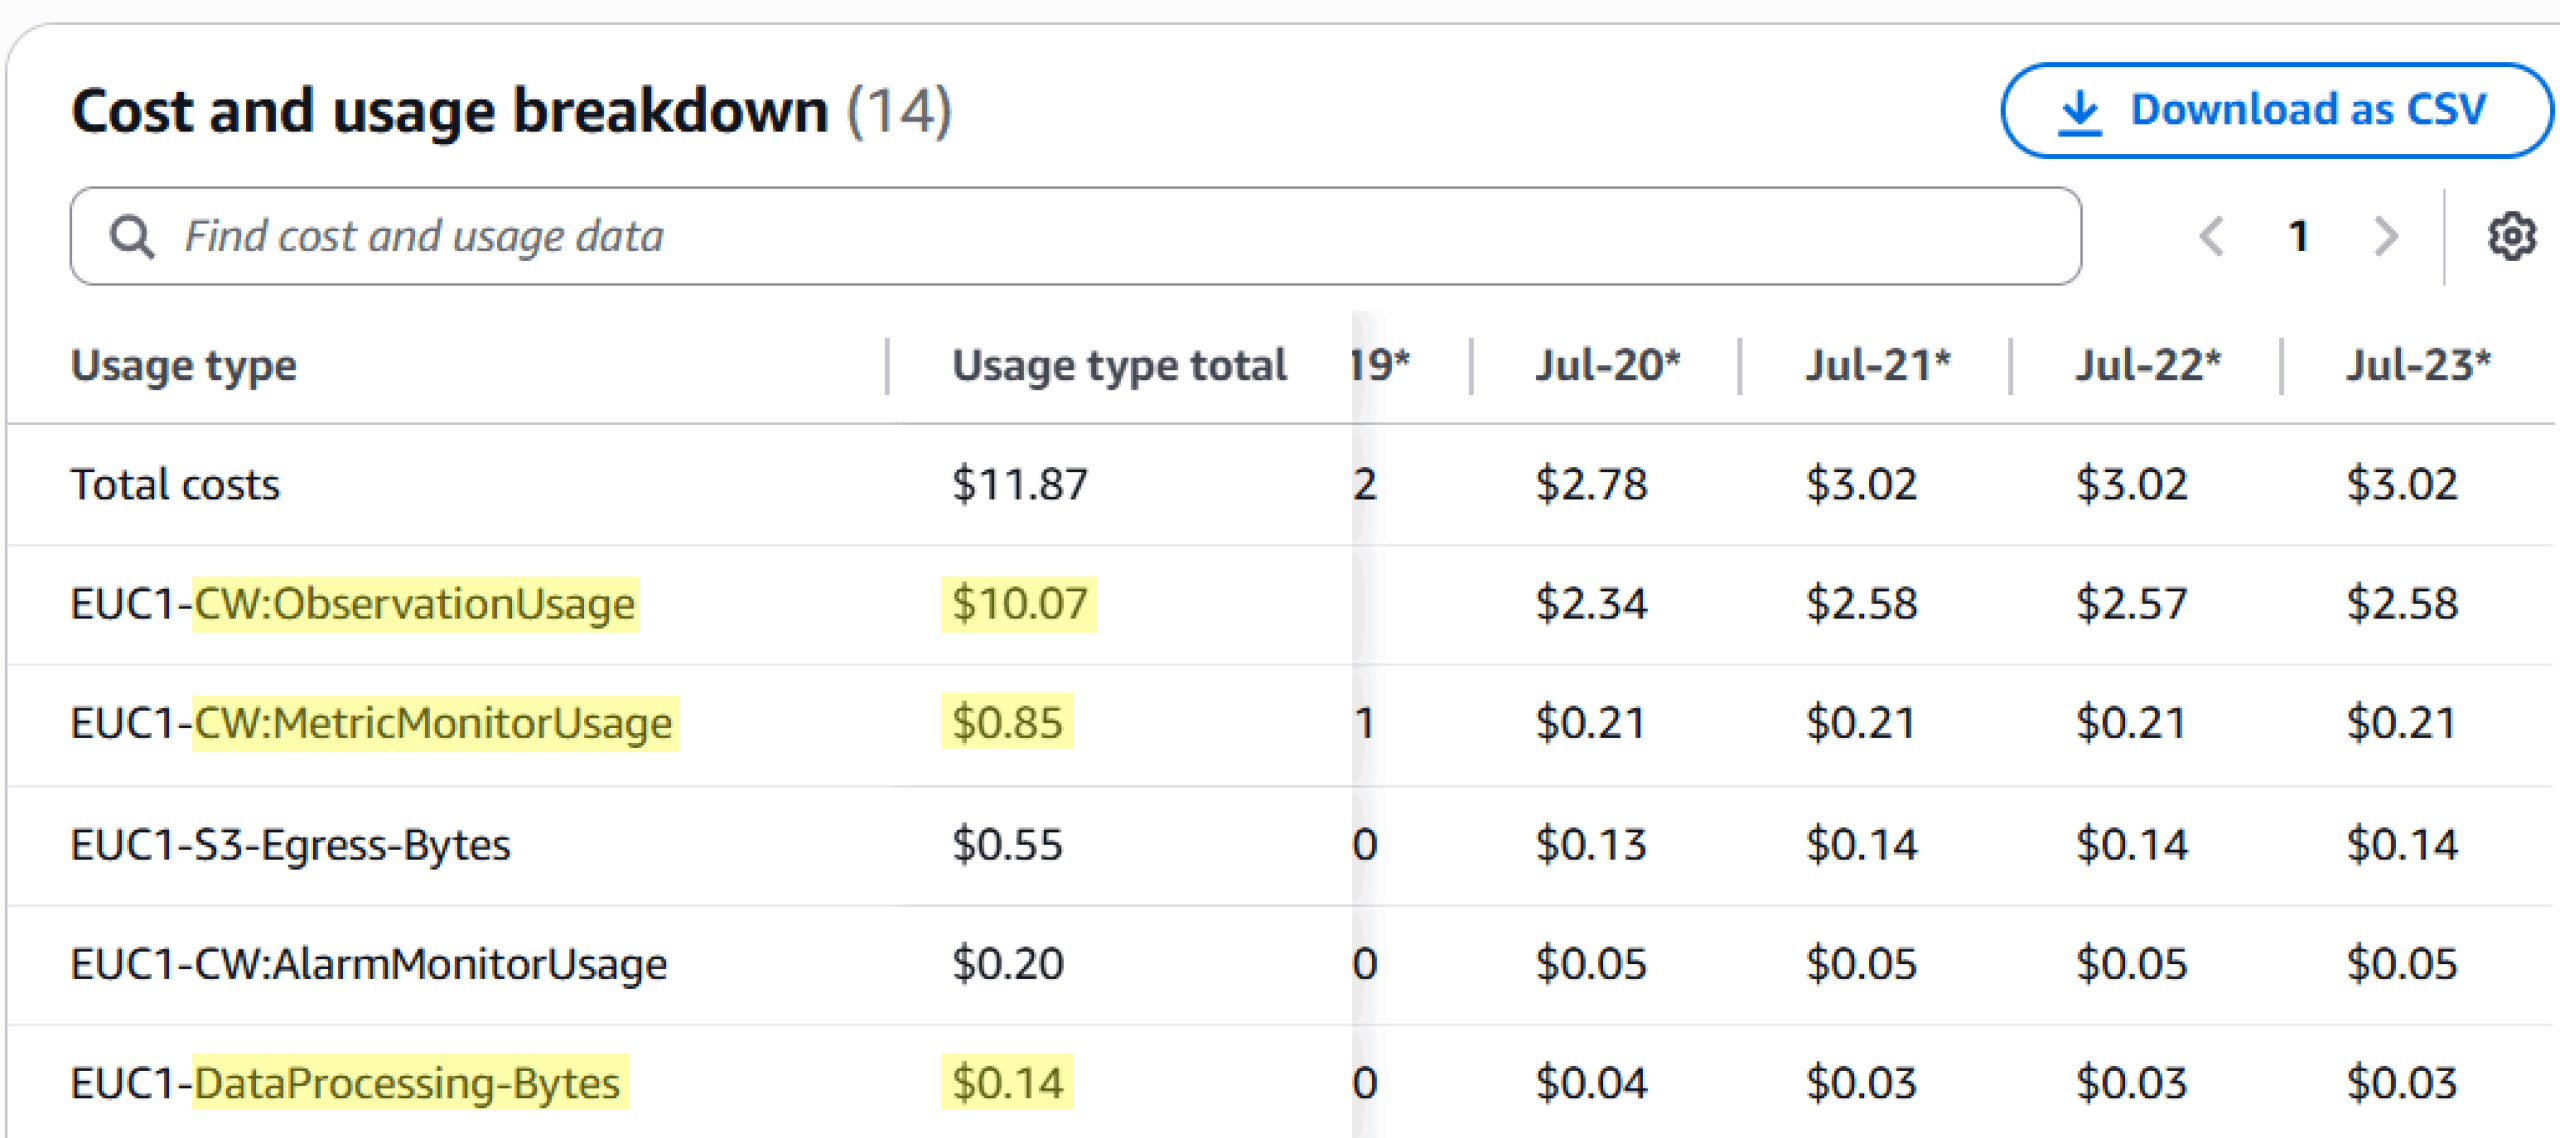
- With Enhanced Insights ON: The costs were dominated by CW:ObservationUsage. This is a modern, bulk-pricing model designed by AWS to efficiently ingest massive amounts of observability data (like our 15,000+ metrics) at a low cost-per-unit.
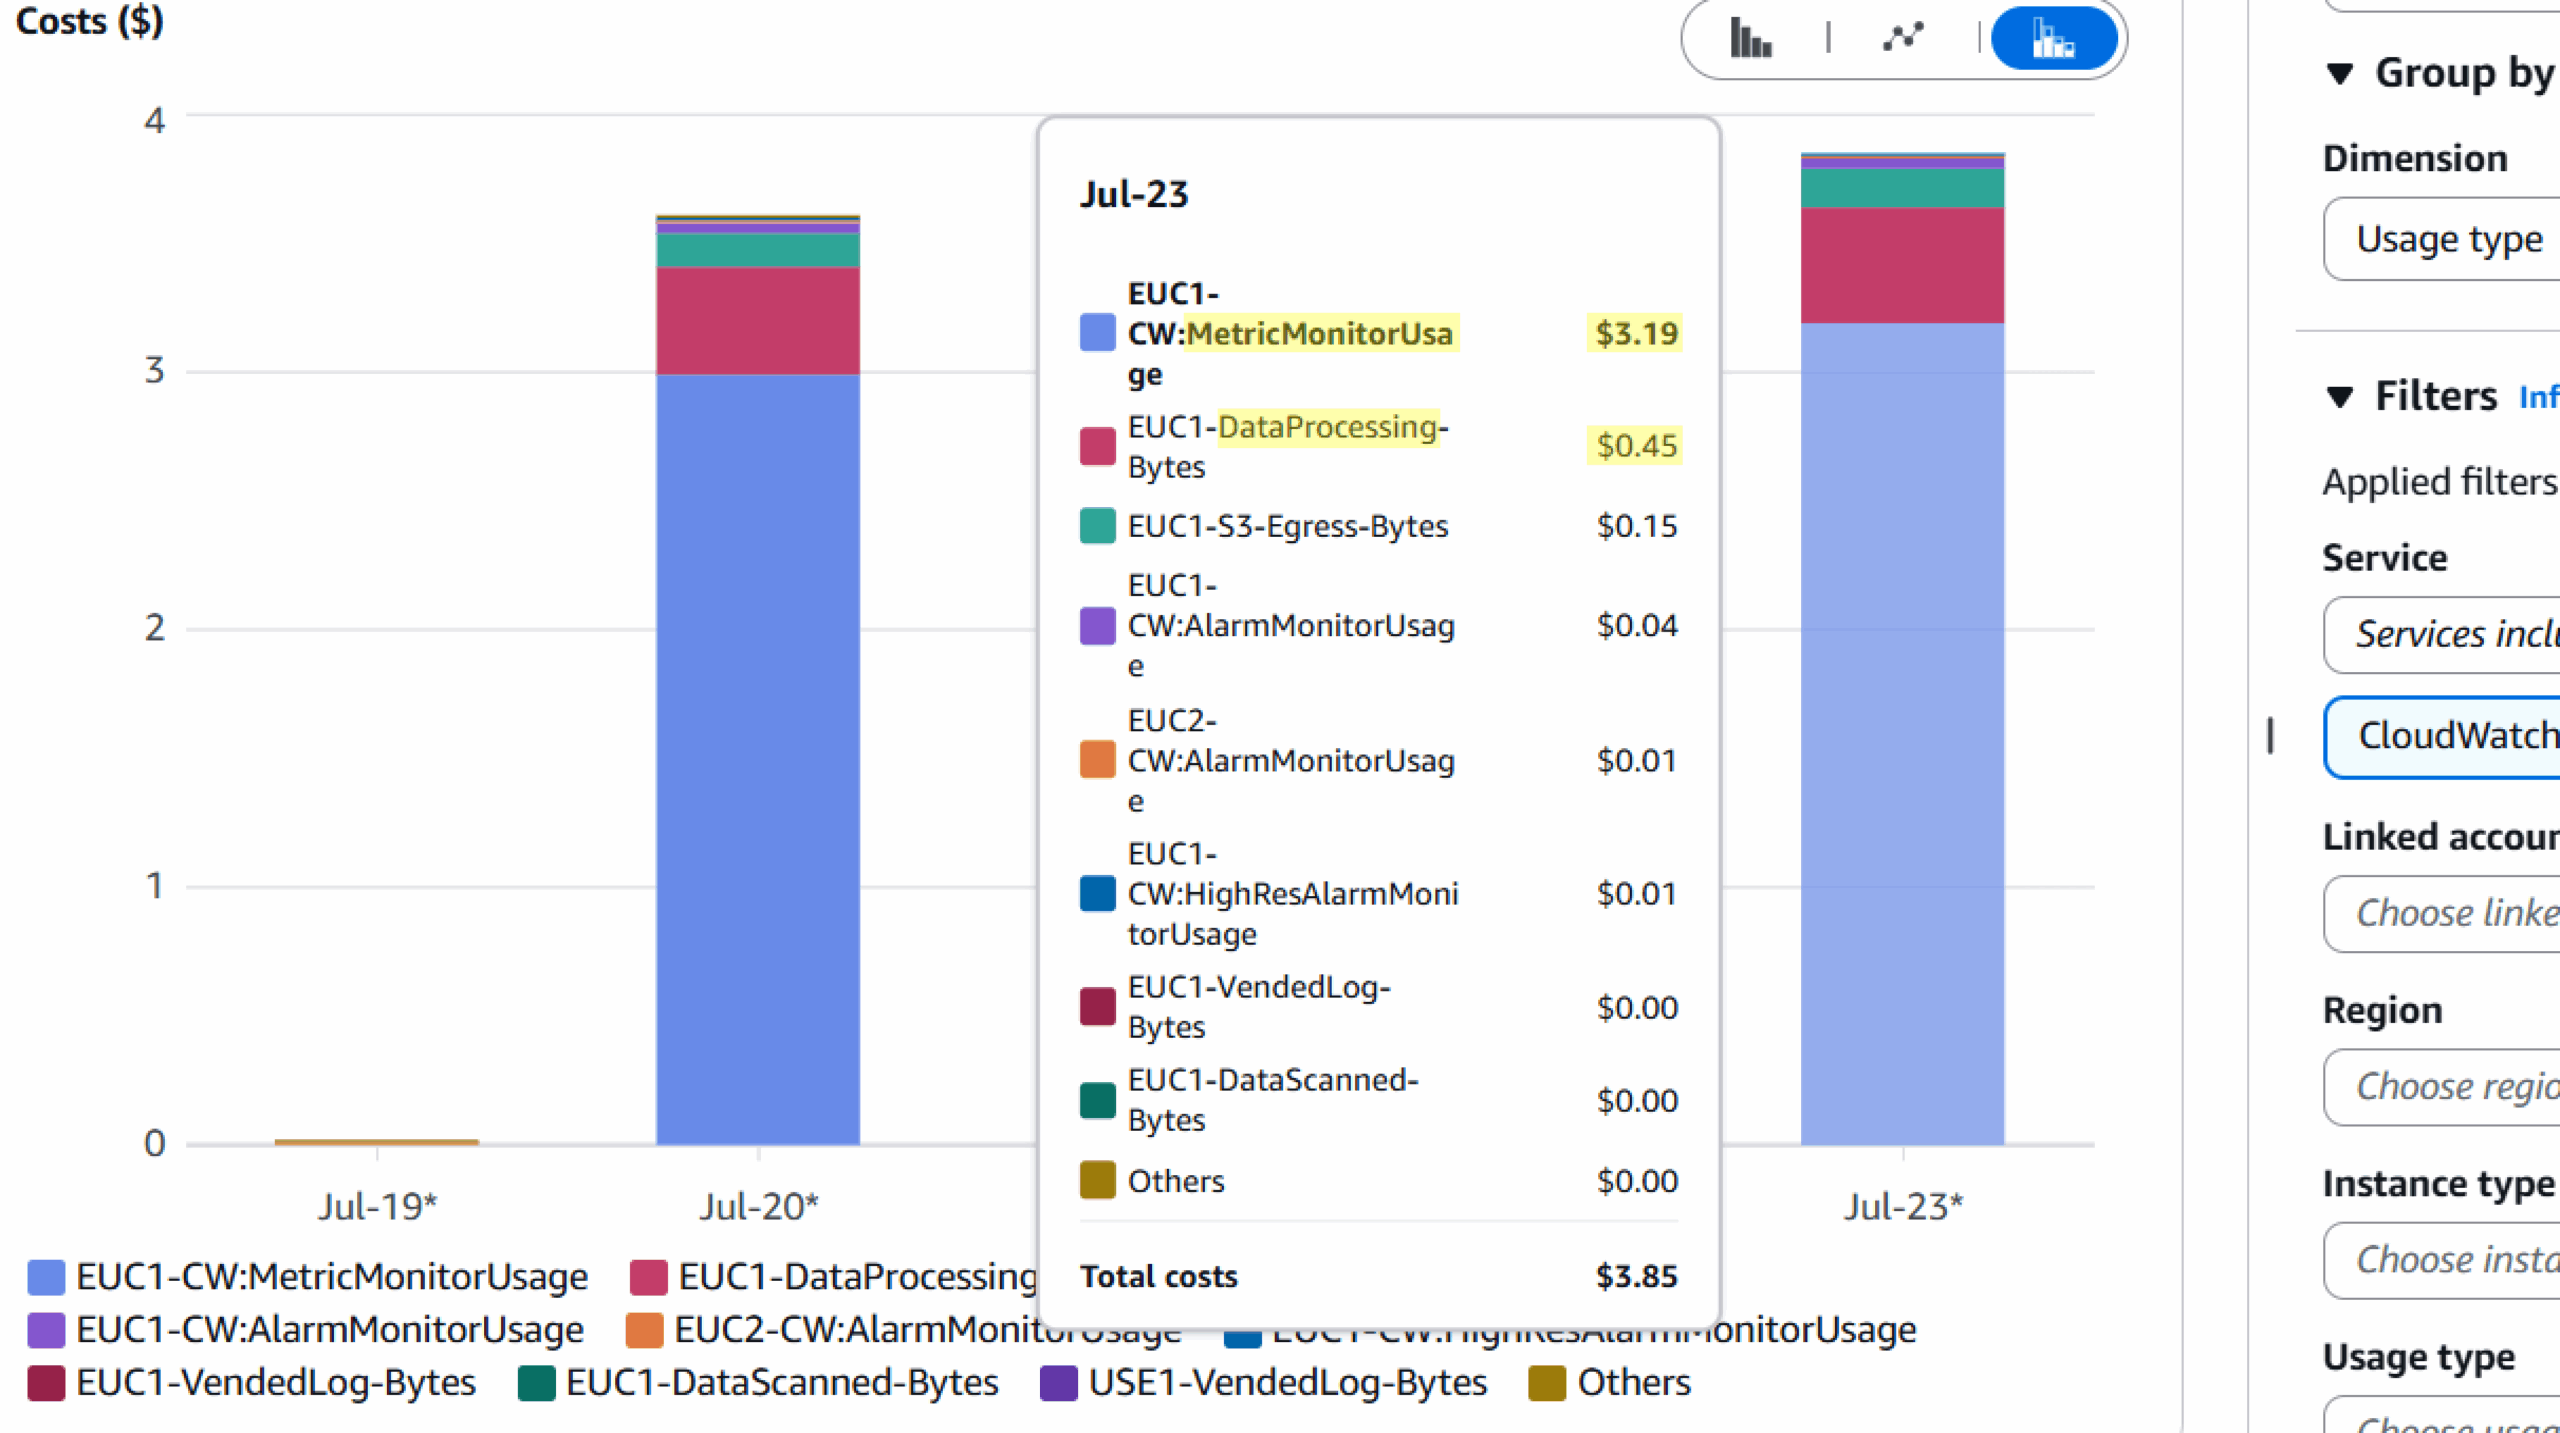
- With Enhanced Insights OFF: The primary cost driver flipped to CW:MetricMonitorUsage. This is a legacy, per-metric pricing model that proved far less efficient, even for a much smaller number of metrics. Our test confirmed that the client’s configuration wasn’t just collecting fewer metrics; it was operating on an older, less cost-effective billing architecture.
With enhanced_container_insights enabled, CW:ObservationUsage is the primary cost driver, showing the modern billing model.
With enhanced_container_insights disabled, CW:MetricMonitorUsage becomes the main cost, reflecting the legacy billing model.
Note how the DataProcessing-Bytes cost increases by more than 10x when enhanced metrics are disabled.
Evidence #2: The “Smoking Gun” in Data Processing
The second, definitive clue came from an unexpected line item: DataProcessing-Bytes. In our test, this specific cost exploded. (Cost shown reflects only a few days of usage)
- Data Processing Cost (Enhanced ON): $0.14
- Data Processing Cost (Enhanced OFF): $1.76
This 12x increase is the signature of the CloudWatch Embedded Metric Format (EMF). It confirmed our hypothesis about the underlying mechanics. In the “disabled” legacy mode, the agent wasn’t sending metrics directly. It was writing them as structured logs, which then required an expensive secondary processing step by CloudWatch to be converted into metrics—a significant overhead the modern architecture avoids.
Cost breakdown with enhanced metrics enabled. Note the low DataProcessing-Bytes cost of $0.14.
Cost breakdown with enhanced metrics disabled. The DataProcessing-Bytes cost has increased by over 12x to $1.76.
The Root Cause Explained: Choosing Your Architecture
Our investigation validated a crucial architectural choice within the CloudWatch EKS add-on:
- enhanced_container_insights = true (Modern Mode): The agent runs in its intended Enhanced Observability mode. It efficiently sends thousands of data points as “performance log events” that are billed under the cost-effective CW:ObservationUsage model, providing deep, pod-level visibility.
- enhanced_container_insights = false (Legacy Mode): The agent reverts to a Standard mode. It collects fewer metrics but uses an inefficient two-step process: writing to logs (incurring high data processing costs) and then publishing them under the more expensive CW:MetricMonitorUsage model.
From Insight to Impact: An Expert Takeaway
This analysis is a powerful reminder that effective cloud cost management is an engineering discipline. It’s not about mindlessly reducing volume; it’s about understanding the architecture and aligning your configuration with the most efficient and scalable service models.
For teams managing EKS, the choice is clear. The modern Enhanced Observability mode offers a win-win: you gain access to far more granular, actionable data for your engineering teams while simultaneously leveraging a more advanced and cost-effective billing model. Before you disable a feature to save money, make sure you aren’t accidentally opting out of a better architecture.
TL;DR/Key Takeaways:
- Enabling EKS Enhanced Container Insights can paradoxically lower your CloudWatch bill, even while collecting 30x more metrics.
- This is because it switches your billing from an expensive, per-metric legacy model to a modern, cost-effective bulk ingestion model.
- Disabling this feature can trigger high secondary costs from data processing via the Embedded Metric Format (EMF).
- The bottom line: Always analyze the underlying billing architecture before reducing metric volume to cut costs.


